

Home
Common Techniques
Classroom Experiments
Virtual Experiments
Tutorials
Games
Glossary
Links
Publishing
Opportunities
About This Site
Contact Us
ZFIN
Cite Us
Chi-squared analysis
Basic information about Chi-squared analysis:
This test shows the probability that the difference in the observed and expected values are due to chance and if they are significantly different from one another. This type of test does not tell the examiner if a specific test has been carried out correctly or whether the results are correct.
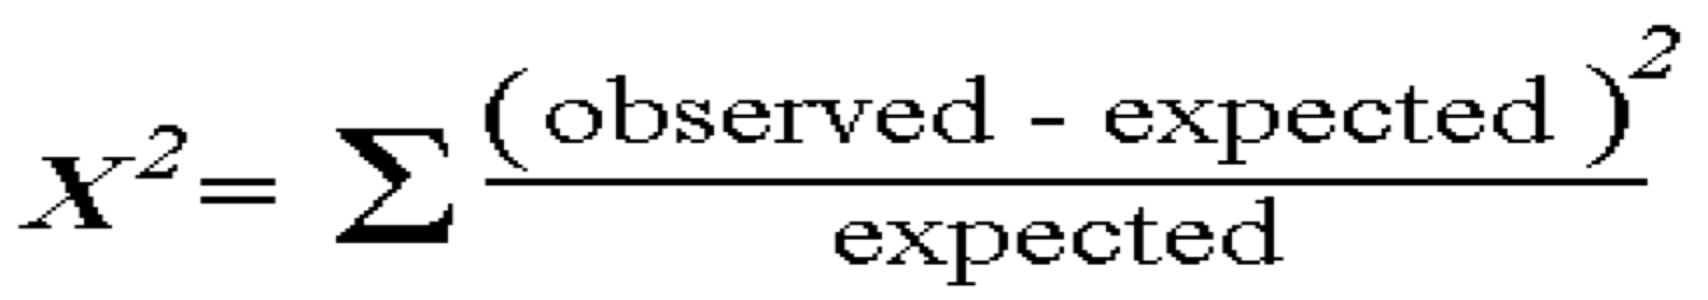
Equation :
Critical values :
P ---0.995 - 0.990 - 0.975 - 0.950 - 0.900 - 0.100 - 0.050 - 0.025 - 0.010 - 0.005
df
1 ------------------0.001 - 0.004 - 0.016 - 2.706 - 3.841 - 5.024 - 6.635 - 7.879
df 2 0.010 - 0.020 - 0.051 - 0.103 - 0.211 - 4.605 - 5.991 - 7.378 - 9.210 -10.597
df 3 0.072 - 0.115 - 0.216 - 0.352 - 0.584 - 6.251 - 7.815 - 9.348 -11.345 -12.838
df 4 0.207 - 0.297 - 0.484 - 0.711 - 1.064 - 7.779 - 9.488 -11.143 -13.277 -14.860
df 5 0.412 - 0.554 - 0.831 - 1.145 - 1.610 - 9.236 -11.070 -12.833 -15.086 -16.750
The critical values table is a set of values that indicate whether the results fit in a specific confidence interval. The values at the top are Probability values (P values) and are related to percentages. For example, the P value of 0.995 that there is a 99.5% chance the results are not statistically significant. A P value of 0.005 means there is a 99.5% (0.005) chance the results are statistically different (or a 0.5% chance that the difference between the expected and observed are due to chance).
- When the Chi-square value is calculated by first using the equation above to determine the Χ2 (Chi-squared) value.
- Depending on the number (n) of tests carried out, the degrees of freedom (df ) are determined using the equation; df= n-1. For example, if you are using Chi-squared to analyze a genetics cross, n is the number of phenotypes you observe.
- The next step is to follow the correct df row over to the closest values to your Chi-squared result. Then follow that value up to the top row to find your P value. For example (see below), if df = 2 and your Chi-squared value is 0.2, then your P value is between 0.95 and 0.90. Thus, there is a 90-95% chance that there is no significant difference between your expected and observed values.
P ---0.995 - 0.990 - 0.975 - 0.950 - 0.900 - 0.100 - 0.050 - 0.025 - 0.010 - 0.005
df
1 ------------------0.001 - 0.004 - 0.016 - 2.706 - 3.841 - 5.024 - 6.635 - 7.879
df 2 0.010 - 0.020 - 0.051 - 0.103 - 0.211 - 4.605 - 5.991 - 7.378 - 9.210 -10.597
df 3 0.072 - 0.115 - 0.216 - 0.352 - 0.584 - 6.251 - 7.815 - 9.348 -11.345 -12.838
df 4 0.207 - 0.297 - 0.484 - 0.711 - 1.064 - 7.779 - 9.488 -11.143 -13.277 -14.860
df 5 0.412 - 0.554 - 0.831 - 1.145 - 1.610 - 9.236 -11.070 -12.833 -15.086 -16.750